This is a continuous series of posts where I share some
intermediate-to-advanced scorekeeping methods and tips. The assumption
here is that you’ve already made it through “Scorekeeping 101” and are working
out ways to improve your skills and expand your enthusiasm for
scorekeeping. I’m also assuming you are using the current version of my
customized scoresheet, which you can download for FREE, as I will use it for
all of these examples unless otherwise specified. Get your pencil ready,
the game is about to start!
In Part One of this series, I demonstrated my
methodology (and notation) for tracking pitches during a game using the current
version of my customized scoresheet (you can download it for FREE right here). In Part Two, I expanded upon this system to reveal my own method for using
the same (or similar) notation to track the order of those pitches quickly,
easily, and effectively. Before we go any further, it’s important that you
revisit what was detailed in both of those posts, as I’m going to build on that
for this final topic in the epic “Counting Pitches” trilogy…how to keep track
of who’s pitching and to whom, and how to use the notation to tally their
respective pitches on the scoresheet.
 Wouldn’t life be simpler if, as in the olden days of yesteryear, a
pitcher just stayed in the entire game and finish the job he started? Sure it
would, but those days are so gone, we can’t even fathom what they were
like…even among the geezerest of us all.
As the pitches throughout the game are being tracked with the notation
system, part of the purpose of all of this documentation is to have a record of
something above and beyond who pitched when. I want to look at a finished
scoresheet and deduce, without unnecessary brain-cramp, when they pitched, who
they faced, and of course, how many pitches – particularly, how many total
pitches and how many of those pitches were strikes.
Wouldn’t life be simpler if, as in the olden days of yesteryear, a
pitcher just stayed in the entire game and finish the job he started? Sure it
would, but those days are so gone, we can’t even fathom what they were
like…even among the geezerest of us all.
As the pitches throughout the game are being tracked with the notation
system, part of the purpose of all of this documentation is to have a record of
something above and beyond who pitched when. I want to look at a finished
scoresheet and deduce, without unnecessary brain-cramp, when they pitched, who
they faced, and of course, how many pitches – particularly, how many total
pitches and how many of those pitches were strikes.
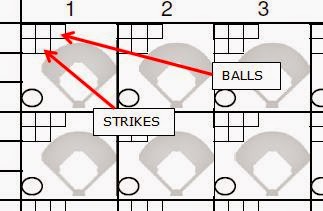
First of all, let’s revisit the area of the scoresheet in which I
track the pitches (and the order of those pitches, if we are so inclined)…the
“pitch boxes” found in each Plate Appearance Box; “balls” upstairs, “strikes”
downstairs:
Also, if you will recall in Counting Pitches Part One, at the end of that post I briefly touched upon the methodology
of counting the pitches, and provided an example of how this happened and where
it goes on the scoresheet:

It was here that I first touched on the method of counting the
marks in the “pitch box” area, plus what happens (the result of the PA) in the
Plate Appearance box. For a 4-pitch walk, I’ll count the 3 notations in the
“ball boxes” plus the final notation of “BB” as the fourth pitch; for an 0-2
home run, the 2 notations in the “strike boxes” plus the final notation of HR
totals 3 pitches.
The main point in this example, is that the total pitches for each
inning are perpetually additive, so where the pitch count in the first inning was
18-13 (18 pitches, 13 strikes) there were 14 pitches, 9 strikes in the 2nd
inning making the total recorded as 32-22 (which is 18 pitches + 14 pitches =
32 total pitches, and 13 strikes + 9 strikes = 22 total strikes). I also
pointed out that regarding the balls in play that aren’t in or near the boxes
that I’ve been counting as strikes, including the called strike 3 (or swinging
strike 3, or ‘foul-tip-to-mitt-caught-for-strike-three,’ there is another type
of pitch not recorded in or near those boxes that
isn’t in play and still needs to be counted. That type, of course, is a
ball…and it usually happens on the 4th ball of a walk (BB) or the ball that hits
a batter (HP), even if one thinks that ball was a strike.
I’m not trying to beat this to death, but to me, counting
inning-by-inning pitch counts in this manner is really important. After a few innings of only recording totals
for each inning only, you’ll need a calculator to understand what’s going on. Doing it this way, you know how many total pitches
have been thrown in 3 innings ‘just like that,’ and you can still tell the
difference between one inning and another ‘on the fly’ (without a calculator),
letting the fella sitting next to you at the game know “Verlander threw 38
pitches in that inning, only 14 in the previous inning” – even if that fella
doesn’t give a darn about that. For
better reasons than that, when that pitcher is finished, his totals (pitches,
strikes) are pretty much totaled up, without a calculator (which can spoil a
good time at the game, you know).
Here’s the area on the scoresheet where the pitch counts are
documented, there’s a big red arrow pointing right to it. In the first inning (and more often than not,
for a few innings afterward) the starting pitcher is on the mound. Sure, that’s a very broad assumption, and one
that dips into the realm of the “blinding flash of the obvious,” but stay with
me on this:

I’ve also circled the spot where the pitcher’s jersey number is
recorded. Again, that’s not super
important now, in regards to the starting pitcher, but it will be for those who
relieve him.
Let’s go ahead and set up a game so I can start recording some of
this. It’s September 2, 2013; the last
game of the season for the Louisville Bats as they wrap up a 2-game series
against the visiting Indianapolis Indians – LHP Andy Oliver is starting for the
Indians.
First Inning: Oliver retires the first 3 batters in order on a
flyout to LF and 2 swinging strikeouts.
He does so with 17 pitches, 11 of them were strikes.

Second Inning: Mike Hessman doubles to start the inning, Oliver
notches two more swinging strikeouts (one of them on a dropped 3rd
strike), he hits Nevin Ashley and gets Jason Donald to groundout to 3B. 19
pitches, 13 strikes in the inning, so the running total recorded in the pitch
area box for the inning is 37 pitches, 24 strikes.

Everybody counts and adds differently, so
here’s a tip from me: Instead of counting the pitches for the second inning
separately, and then adding to the previous inning totals, I start counting the
second inning from the last number counted in the first. In the above example, I start counting with
Oliver’s first pitch to Hessman as “18,” then go through all the pitches to
come up with 37 as the total – then I start counting with Oliver’s first strike
to Hessman as “12,” then go through all the strikes to come up with 24 total.
You can do whatever you want, but there’s only so much time between innings,
and personally I don’t like to get behind on this during the game. So, here’s
the “running count” for the second inning detail above:

For the third inning, then, Oliver
faces 4 batters, allowing a single and striking out three (all swinging,
impressive!) for a total of 52 pitches, 36 strikes so far (over 3 innings of
work).

In the fourth inning, Oliver walks Hessman on 5 pitches, then
retires the next two batters he faces on popouts, both to the second
baseman. Suddenly, things get weird –
the skies open up, torrential rains occur, and the game is held up on a rain
delay. The call is made as Oliver has a
1-0 count on Ashley; I’m a good scorekeeper so I record the time the rain delay
started to the left of the PA box.

As the delay approaches the hour mark, one can be sure that once
play resumes, there will certainly be a new pitcher. After an hour and 30
minutes, Ryan Reid starts warming up, and it’s official…a rain delay-forced
pitching change!
This is an unorthodox manner in which to
change pitchers during an inning, especially since it’s occurring in the middle
of an at bat, but these things do happen, so this is a great opportunity to
demonstrate the notation and methodology.
First things first, I need to “close” Oliver’s account on the
scoresheet. I can’t finalize all of his
line score stats, as he is responsible for the runner on first, but I can record
what I know now, as well as tally up his final pitch count and add the
appropriate graphic notation on the scoresheet so it is apparent when he finished pitching and when the new
pitcher took over. Oliver’s final
pitch count goes where I’ve been recording it, I’m going to leave some room to
the right and add a backwards slash that creeps into the area right above it.
To the left of the PA box, I make a note that Oliver’s count ended
with 1-0 (I’m doing this right above my rain delay notation). Since the change
is occurring during an AB, at the top of the PA box I record Oliver’s jersey
number (41), then a slash with the new pitcher’s jersey number (43). I also record Oliver’s jersey number only (not
Reid’s…at least not yet) in the upper left hand corner of the box above the
“pitch count area” that hasn’t been used for anything up to this point.

You can get creative with your own
notation, but the rule to follow is simple: whatever you come up with, you need
to be able to remember how you did it again and again. For any of my
scoresheets where a pitcher changes during an AB, for whatever reason, I follow
the same protocol consistently…thus avoiding the “uh, what the hell was this
all about” many years later when I’m recalling this game via the document. Some
situations arise only once in a blue moon; simplicity and consistency are
important.
The game resumes at 4:01pm, I add this to my rain delay notes to
the left of Ashley’s AB box and record the total time of the delay. Reid
strikes out Ashley on 3 pitches (all of them strikes) to end the inning. Oliver’s line score can now be closed out,
and so can the other totals for the inning (Runs, Hits, Errors, LOB). I record
Reid’s total pitch count on the line right above the pitch area box, adjacent
to the backslash I left hanging up a little bit, and I also record his jersey
number in the upper right hand corner, on the opposite side of Oliver’s number.

Now all this funkiness is as clear as glass on the scoresheet.
With traditional scorekeeping methods, tracking this single event would require
copious handwritten notes that would threaten to destroy the flow of the
scoresheet. With my method, everything is documented cleanly and
accurately. Here’s what we know, just by
looking at the detail featured above:
·
41
Andy Oliver faced 15 batters, threw 69 pitches (43 strikes)
·
At
the 1-0 count for the 16th batter he faced, rain delay called at
2:17pm
·
Game
resumed at 4:01, at which time 43 Ryan Reid replaced him
·
43
Ryan Reid finished the inning facing 1 batter, threw 3 pitches (3 strikes)
So in that large, previously unused area, it can now be revealed that this is an important method of recording who is pitching and when they are pitching. Remember, to start the game I didn’t record Oliver’s jersey number up there…he’s the starting pitcher, the “Pitchers Faced” log below indicates this so it isn’t necessary (however, feel free to record his number if you want, in that area at the start of the game…it’s redundant, but that doesn’t really matter). In the 4th Inning, in that same area, his number in the upper left corner indicates that he was the pitcher that started that inning. Reid’s number in the upper right corner indicates that he was the pitcher that ended the inning.
Now that I’ve introduced this method of notation, I can carry this
through the rest of the game and identify who pitched when, what their pitch
count was, and easily identify pertinent info to tally each pitcher’s line
score. I detailed one “dotted line” to illustrate this, I’m sure you can
visualize the rest…Reid stayed in for the 5th inning, then was
relieved by Graham Godfrey, and so on so forth.

I know you’re rubbing your eyes right now,
yes that is Matt Hague brought in during the 9th inning (in a SAVE
situation, no less), who allowed a walk-off Grand Slam to Denis Phipps to end
the game. Baseball is crazy, especially Minor League Baseball on the last day
of the season, after September callups.
Here are the completed scoresheets for this game.


Now, let’s look at a more traditional pitching change during an
inning…it works very much the same way, but with one distinct difference. For
this example, let’s go back to Busch Stadium in St Louis, MO, for the 2013
World Series Game 3. Yes, that’s the
game that ended with an obstruction call.
It’s the bottom of the 7th inning; Jake Peavy started the
game, went 4 innings – he threw 63 pitches (43 strikes) and was relieved in the
5th inning by Felix Doubront, who worked 2 innings, throwing 25 pitches
(15 strikes). The game is tied 2-2, and
Craig Breslow is on the mound now, his jersey number is 32 and he’s facing the
top of the order.

Breslow faces 2 batters; Matt Carpenter who reaches on a single to
SS, and Carlos Beltran who is hit by the first pitch he sees. Two men on, nobody out; John Farrell decides
he has had enough of Breslow’s heroics and brings in Junichi Tazawa to face the
righty Matt Holliday. Before Tazawa is
ready to strike, I need to finalize whatever information I can on the
scoresheet…which happens to be Breslow’s pitch totals and all of his line score
except for the R/ER.

I record his pitch totals in the pitch area, add the backwards
slash, but I don’t record Tazawa’s number in the upper right corner yet. Why? Because he, too, may be relieved by
another pitcher…I don’t know yet for sure.
I do know that I need to indicate somehow that Beltran was the last
batter Breslow faced, and that Holliday will be the first batter that Tazawa
will face.
I’m going to do this in between Beltran’s and Holliday’s AB
boxes. I’m going to do it with a
backward slash that “joins” both boxes – in Beltran’s AB box zone, I record
Breslow’s jersey number, and in Holliday’s AB box zone, I record Tazawa’s.

Now it’s very clear…Breslow faced Carpenter and Beltran, and
Tazawa is taking over. KaBOOM!!
Let’s continue…Holliday doubles, driving in Carpenter and Beltran
(Holliday to 3B on the throw). Well, THAT worked out, didn’t it? Tazawa
strikes out Matt Adams and Yadier Molina, walks David Freese (who is replaced
by a pinch runner, Daniel Descalso), and the inning ends when John Jay flies
out to CF. Now I’m going to update the pitch area with this information. This
is what the AB boxes look like.

At a glance, it’s apparent that Breslow is responsible for the two
runs that did score…again, having the jersey numbers between the AB boxes
provides a quick graphic reference of the pitching change, what happened before
it, and what happened after it. I included a second graphic of the same AB boxes (with red border) to illustrate the work of both pitchers.
I update the pitch detail area with Tazawa’s jersey number in the
upper right corner, add his total pitch count.
In the Runs/Hits/Errors/LOB fields, the total for the inning is updated,
as is Breslow’s line score (but not Tazawa’s yet…he might stay in the the next inning…at a minimum, I’ve recorded what
he did this inning in the AB boxes and pitch detail area, but I’m going to
leave his line score alone until I know how the bottom of the 8th is
going to start).

For a moment, don’t look at the AB boxes…just focus on the pitch
area detail. Breslow (32) is on the left
(started), Tazawa (36) is on the right. Piece of cake. Two pitchers in the inning, 2 runs, 2 hits, 0
errors, 0 left on base.
Who allowed the hits? Who is charged with the runs? Now you can look at the AB boxes again.
Fantastic!!
If Tazawa stays in for the 8th
inning, I don’t have to “carry over” his jersey number or anything…just his
running pitch count total. As it turns out, Brandon Workman takes the mound for
the bottom of the 8th, so his number goes in the upper left corner,
I finalize his line score, and start anew with his pitch count totals.
It gets a little messier for 3 pitchers in an inning, but still
very manageable. From the same game, but
the top of previous inning:

Starter Joe Kelly (58) faced two batters, was replaced by the
LOOGY Randy Choate (36) for one batter and didn’t record an out, then was
replaced by Seth Maness (61). Once again, I included a second graphic (with red border) of the same AB boxes to illustrate the work of all three pitchers, as indicated by the
notation between the AB boxes.
As it was with one pitching change, the pitch detail area looks
similar when there are two pitching changes…room is at a premium, but heck…now
that you know what you’re looking at, it unfolds like a neat little story.

This graphic notation method really helps out when working out the
line score! One no longer has to rely on their memory…let the scoresheet do the
work!!
I’d show you what 4 pitchers in an inning
looks like, but I don’t want your head to explode.
Here are the completed scoresheets for this game:


This concludes the “Counting Pitches” trilogy for this series,
good luck!!
Coming up Next:
Tracking Team RISP - It's Trickier Than You Might Think
If there are any topics you’d like to see covered in future installments, please let me know here (via comment) or connect with me on Twitter or Facebook!
Coming up Next:
Tracking Team RISP - It's Trickier Than You Might Think
If there are any topics you’d like to see covered in future installments, please let me know here (via comment) or connect with me on Twitter or Facebook!
Here’s hoping I’ll see you at the ball game, and if I do…be sure
you have plenty of sunscreen on!!


