Thursday, July 18, 2013

For Those Of You Scoring At Home: Counting Pitches - Part Two

Presenting a new (and now, continuing) series of posts where I share some intermediate-to-advanced scorekeeping methods and tips.  The assumption here is that you’ve already made it through “Scorekeeping 101” and are working out ways to improve your skills and expand your enthusiasm for scorekeeping.  I’m also assuming you are using the current version of my customized scoresheet, which you can download for FREE, as I will use it for all of these examples unless otherwise specified.  Get your pencil ready, the game is about to start!


In Part One of this series, I demonstrated my methodology (and notation) for tracking pitches during a game using the current version of my customized scoresheet (you can download it for FREE right here).  Before we go any further, it’s important that you revisit what was detailed in that post, as I’m going to build on that for this topic…how to accurately track the order of pitches, and do it quickly and easily.


This isn't necessarily ground-breaking stuff, I’m sure, but I feel it is still rather unique…when I hinted that this topic would be covered in this installment of the series, I received a great deal of feedback, most of it consisting of anticipation.  When I developed and practiced my notation, I did so hoping that someday I could use it to track the pitch order, thereby beginning with the end in mind.  It was a process that, very much like looking for your lost car keys, was a little bit frustrating…trial and error was confusing, and mostly ending up in the “this is too complicated, and I’ll never be able to do this real time so it’ll never work” bucket.  I’m happy to report that the solution was, quite literally, right in front of me the whole time; so now, I’ll get it in front of you.

For the record, the Project Scoresheet method allows the scorekeeper to track pitch order to some extent; however, I’m still digging into this myself, so I’m not ready to discuss that at this point in time.

As I stated in the previous post, counting pitches is both a necessary aspect of solid scorekeeping, and a useful tool to support the recounting of a variety of events within any baseball game.  For a variety of reasons, most of them specific to the scorekeeper’s individual needs, the order of the pitches is a critical aspect of the documentation process and the data can reveal a great deal of information that is enlightening and often revelatory in nature.

This is a high-brow way of saying, when your game announcer proclaims “Volquez is on fire tonight, he’s thrown 11 first-pitch strikes in 4 innings of work, that’s exactly what Bud Black is looking for from his starter” you can shower yourself in pride by exclaiming “YES, I am fully aware of this!!”

A quick recap of the specific areas of the scoresheet that will be used, as well as the previous notation, is in order.  Here are the “pitch boxes” found in each Plate Appearance Box; “balls” upstairs, “strikes” downstairs:
Remember when I casually stated that the intent of the boxes to be used from left-to-right would be important later?  Later is now.

It should be second nature to the intermediate scorekeeper to start with the first pitch, whether it’s a ball or a strike, in the appropriate box at the farthest left-hand side.  The order and orientation will help us record the pitches in order, and be able to interpret the notation quickly.  
I’m going to use the same notation previously used, but only in the “strike” boxes.  I will no longer use the “forward slash” in the “balls” boxes, and I also won’t be using the “X” for foul strikes outside the “strike” boxes.  Instead, I’m going to use numbers in those areas.  HOOAH! NUMBERS!

This is where I wink at you and chuckle a little bit, I told you this was simple!

This is going to look like one of those Logic Puzzles, where you are presented with a series of numbers and symbols and are asked to determine the numbers that are represented by the symbols.
If I asked you to determine what numbers are represented by the symbols in this series above are, you would smugly reply “3, 5, and 6 respectively.”  So far, so good.

The pattern above is not much different than this one:
The symbols are different, but you can also determine that the two dots are, respectively, 3 and 5; and that the “x” is 6. 


Yes, it’s true.  1,2, 4, and 7 are balls – the dots (hinomaru) are called strikes – the “x” is a foul strike…and they are all in the order in which they appeared!

Pitch #1: Ball (1-0)
Pitch #2: Ball (2-0)
Pitch #3: Called Strike (2-1)
Pitch #4: Ball (3-0)
Pitch #5: Called Strike (3-2)
Pitch #6: Foul Strike (3-2)
Pitch #7: Ball (the batter takes his base)

This is precisely how I am going to document each pitch, type of pitch, and the order the pitch was offered without having to redesign my scoresheet, or having to write this stuff down on a separate piece of paper.  While we are still having the time of our lives, let’s commit this philosophical approach in a live fire exercise!  We’ll use actual game data from the top of the 1st inning at Louisville Slugger Field in Louisville, KY where the Durham Bulls’ top of the order is 
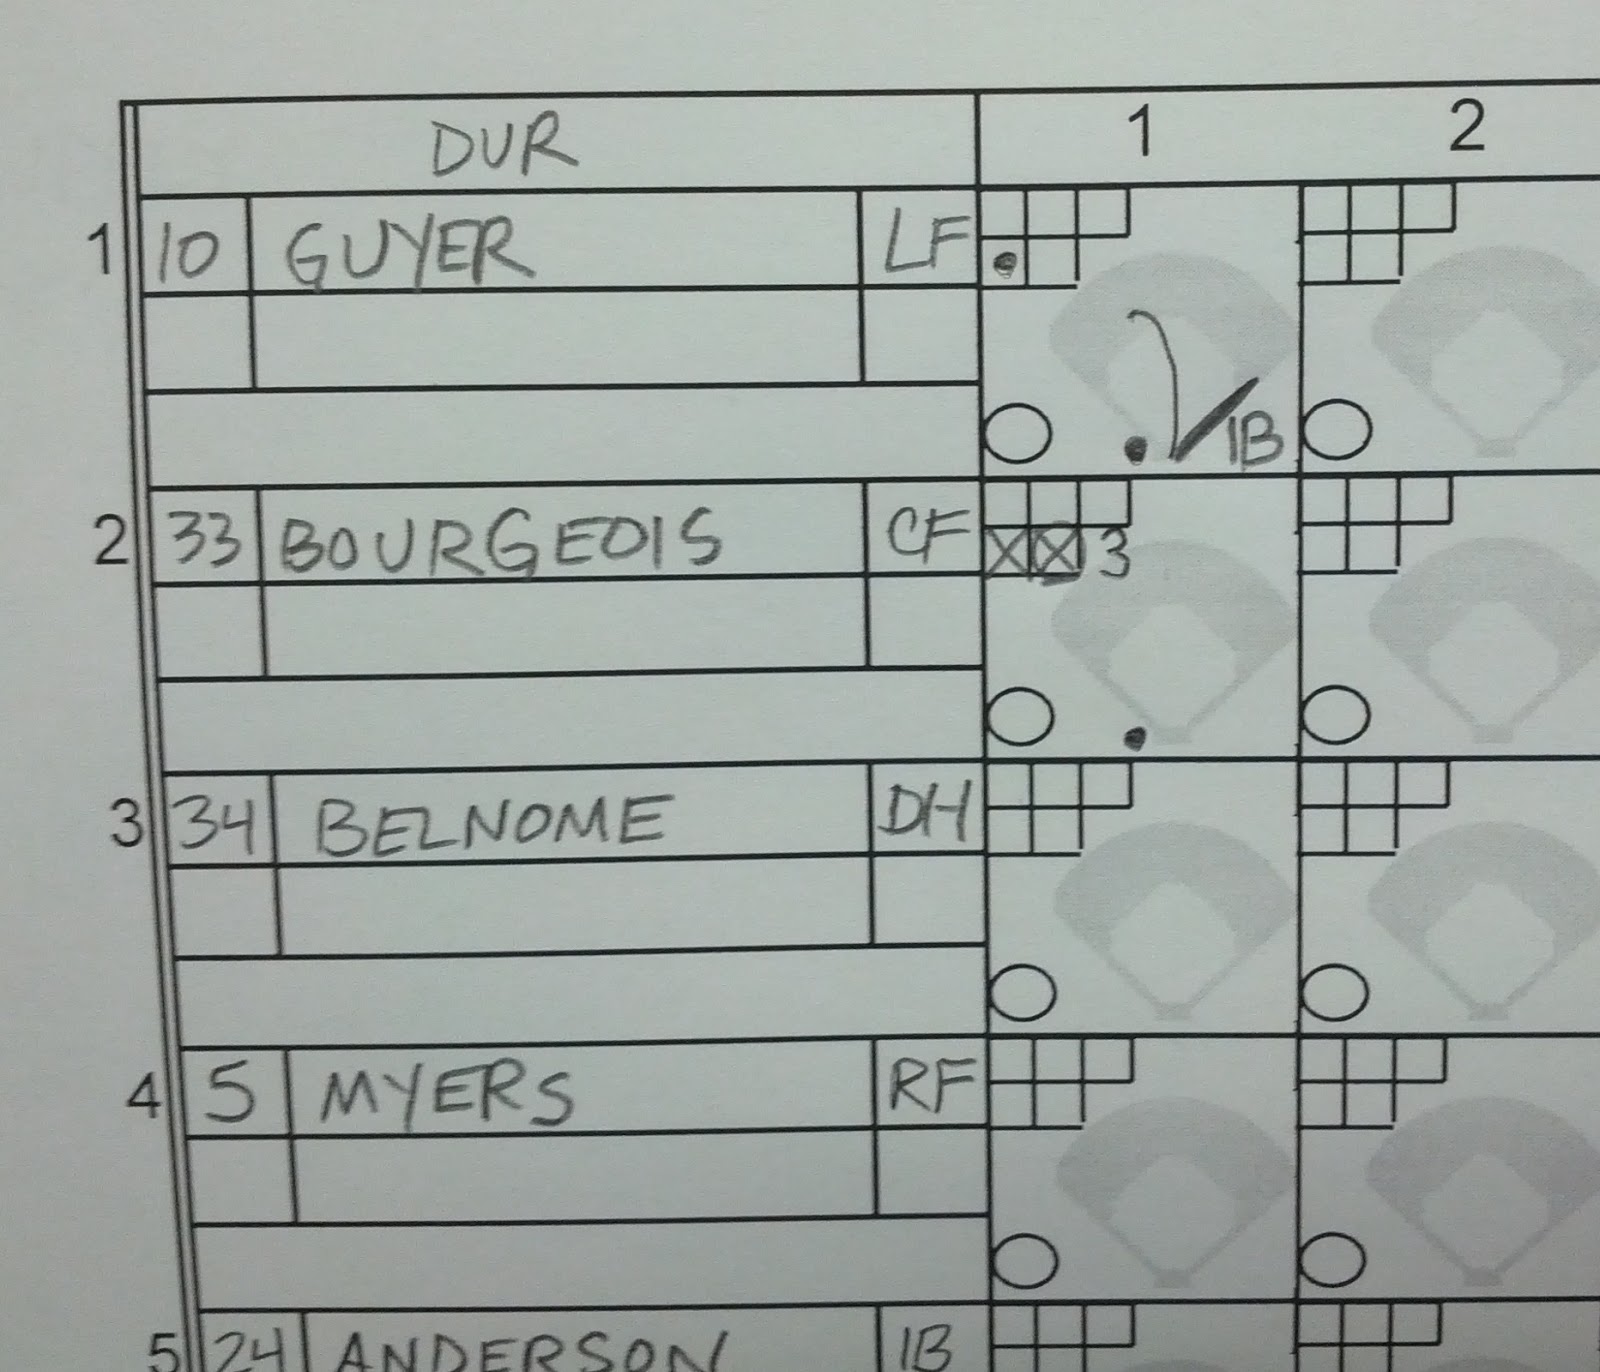
facing Louisville Bats starting pitcher Pedro Villareal on June 10, 2013.  The scoresheet is all set up with the starting lineups, and we are ready to go!

Lead-off batter Brandon Guyer steps into the box, and Villareal’s first pitch is taken for a strike.  The hinomaru appears in the first “strike” box on the left, same practice we've been accustomed to.  The count is 0-1.

Guyer hits a line drive single to the left of Shortstop Emmanuel Burriss’ ear holes that drops for a base hit.

Jason Bourgeois is next, he fouls off Villareal’s first pitch.  The “X” goes in the first “strike” box on the left.  The count is 0-1.

Bourgeois shows bunt, and again fouls off Villareal’s second pitch.  The “X” goes in the second “strike” box from the left, I circled it to indicate a bunt was either shown and/or executed.  バントを指定!! The count is 0-2.
Hang on, here comes the GOOD STUFF.

Villareal’s next offering (his third pitch of the at bat) if fouled off again.  Bourgeois has Pedro’s number, it seems, but it’s still early.  The count remains 0-2; but I’m not going to mark an “X” to the right of the second “strike” box as I would have done before…I’m going to write a number “3” = for the third pitch of the at bat.
Take a moment and look at the graphic data ‘real quick’…3 pitches, 3 strikes, all of them foul strikes, from left to right.  Where the “X” was used before, ad nauseum, for each foul strike recorded outside of the strike boxes, I will use numbers for them all, and each of those numbers will correspond with the order of the pitch as delivered.

Why then, is the “X” still used in the “strike” boxes? And the hinomaru as well?  The first two strikes will always be those types of strikes, plus the swinging strike.  The called strike and swinging strike will never occur outside of the two strike boxes, only the foul strikes will…therefore, the “X” notation is assumed for those strikes “outside of the box,” always.  Sure, I could keep using them, but then I will lose count.  This will be more evident as we proceed, but for now think about the simple logic puzzle I presented earlier.  There are going to be pitches in our sequence where a number must be indicated, otherwise the puzzle can’t be deciphered quickly and accurately.  The type of pitches in strike boxes one and two can be any of 3 different types, but outside the “strike” boxes, and in the “ball” boxes as well, the type of pitch will always be either a “ball” or a “foul strike.”

Moving on with Bourgeois’ at bat, Villareal throws outside for a ball.  The count is 1-2; as I just explained, anything in the “ball” boxes will always be a ball, so the forward slash notation is no longer needed…it will always be a number, and for this fourth pitch of the at bat, that number is going to be a 4.
Stating the obvious: 4 pitches so far, and the order is strike-strike-strike-ball.

Bourgeois fouls off Villareal’s fifth pitch in the at bat, the count is still 1-2.  For this foul strike, the number “5” is recorded in the area to the right of the “strike” boxes, right next to the number “3.”

Villareal’s sixth pitch finds Bourgeois’ bat, as he flies out to right fielder Denis Phipps to record the first out of the game.  The at bat ends with a count of 1-2, 6 pitches total…we know the types of pitches, the order in which they were dealt with, and the results are unanimous…this is great, and it’s easy to document and interpret quickly!!

Here’s what this would have looked like on the scoresheet, using just notation and not tracking the order:
It was fantastic to see all of the pitches the way the notation was used before, but now that the order can be tracked, the “old way” doesn't really tell the same story.  It can’t be determined that the first pitch of the at bat was a strike, and it also can’t be determined that the first pitch out of the zone didn't happen until the fourth pitch.  That’s like hypnotizing chickens!!

The Designated Hitter Vince Belnome, is next, batting third.  Guyer is still hanging around on first base.  Belnome steps into the box on the left-hand side of the plate, and takes Villareal’s first pitch for a ball.  The count is 1-0, the number “1” appears in the first “ball” box to indicate this.

Belnome takes the next pitch for a ball as well, the count is 2-0.  2 pitches, 2 balls, number 1 and number 2, from left to right.

Villareal’s third pitch is nodded off by Belnome.  The count is 3-0.

Belnome fouls off the fourth pitch of the at bat; I mark this one as an “X” in the very first “strike” box.  The count is 3-1. 

Villareal offers something Belnome really likes, he swings and misses for strike 2.  When he does so, that clever speedster Brandon Guyer swipes second base effortlessly, without a throw.  The forward slash goes in the second “strike” box; the count is full.  I also notate Guyer’s SB, indicating that it happened while Belnome was at the plate (SB 34)…because he stole the bag on Villareal’s 3-1 pitch, I add this detail to the PA box to the right of Guyer’s.
Think about this one more time.  Previously, with the “ball” boxes full of slashes and the “strike” boxes occupied with an “X” and a forward slash, all that really told us was that at this point, Belnome worked a full count here.  Now, with the number notation, a little bit more is known…Belnome actually worked from a 3-0 count to a full count in the space of two pitches.  Depending on your need and what the scorer does with this information, that’s a pretty significant change in the story, don’t you think?

Belnome fouls off Villareal’s sixth pitch of the at bat.  Now that we know the order, it’s clear that Belnome went from passive to aggressive during this plate appearance!  The number “6” is recorded in the area just outside of the “strike” boxes, as I did during Bourgeois’ at bat. 
I already know that any number there indicates a foul strike (just as any number in the “ball” boxes indicates a ball) and just as the guy sitting in the row in front of me says “I wonder how many pitches this guy has seen?” I blurt out “SIX” because I’m counting them, and I’m counting them with numbers.

Belnome hits a nearly sky-high fly ball to shallow left field, Felix Perez cradles it for out number two.  Seven pitches in that at bat!  If you glance at the previous two batters, and just briefly count the number of marks you've made, you can blurt out that Villareal has thrown 2+6+7 = 15 pitches in this inning so far, no big whoop…and you can also blurt out that he’s thrown a total of two first pitch strikes so far! Nice!!
Belnome also becomes the first player of the game to bat with runners in scoring position, he’s 0-for-1 in Team RISP…I will cover this in a future post!

The indefatigable future baseball superstar Wil Myers, batting cleanup for the Bulls, steps into the batter’s box.  Ahem.  Guyer is still in scoring position with 2 outs.  Myers takes Villareal’s first pitch for a ball.  The count is 1-0, Villareal has thrown 2 first pitch strikes to 4 batters so far.

Myers fouls off Villareal’s second pitch of the at bat, the count is 1-1.  Again, I use the “X” in the appropriate “strike” box.

The third pitch: swingandamiss! Myers is behind in the count 1-2.  Forward slash in “strike” box number 2!

Myers lays off the fourth pitch and takes it for a ball; the number “4” goes in the appropriate “ball” box, the count is 2-2. 
This particular at bat, in terms of count, order, and notation, is probably the best practical example so far of the way the premise of the simple logic puzzle that started this discussion works the best…and also proves out its ease of use in this application.  While the document is being generated, the notation is simple; after the fact, interpretation is just as easy!  You should now be able to look at the at bat in two different ways: first, as a 2-2 count and second, in the precise order of events – ball-strike-strike-ball.

Now that Villareal knows what pitches Myers likes the best, he gets him to swing and miss on the fifth pitch of the at bat to record the third and final out of the inning.
Myers joins Belnome in the 0-for-1 with runners in scoring position club, the Team RISP so far is 0-2. He is also the first player to get a mark in the “Runners in Scoring Position with 2 Outs” category.

Counting the pitches, as before, Villareal threw 20 pitches total, 14 for strikes.  Of those 14 strikes, 10 of them saw contact.  Now, we know a few more things:
  • Villareal is 2-4 in throwing first pitch strikes
  • 2 of the 4 at bats ended with a “pitcher’s count,” which is good for Villareal (even though one of them ended with a base hit)
  • One batter came from behind a “batter’s count” to work a full count (Belnome), one batter saw 3 strikes before he saw a ball (Bourgeois), etc

There are a lot more “stories” just from this inning that can be gleaned from the new order notation, all of them are important but the very last bullet above is the most significant as the scorekeeper can derive a plethora of analysis, either during the game or 10 years later, all from this document.  It’s a lot like acquiring a copy of the Annotated Complete Works of Arthur Conan Doyle; very little detail is lost in context and external research for this event is intensely minimized.

This certainly isn’t the “final frontier” of pitch tracking on scoresheets, but this revised method and notation (in my opinion, at least) covers a larger gap of data substance between simply counting them and counting them with the order that I was sure was there, but really had no idea until I tried it and it worked.  This aspect of enjoying the game, for me, has been enriched beyond my personal expectations.

The ease of use and learning curve is also astonishing.  After only one trial game, I found myself slipping into this updated methodology in a more comfortable fashion than I did when I first started counting pitches altogether.  Granted, I had been counting pitches for several years, but I still believe that the process took hold in my brain so effortlessly that I still find myself shaking my head in disbelief that I never thought of this sooner!!  After 20-or-so games of applying this method to counting pitches, I only slipped back to the previous method one time, and I caught myself doing so during the at bat in which it happened.

Here are my completed scoresheets for this game in its entirety, with complete use of this notation, all pitches counted and recorded, and all pitch order tracked. 


I’m certain that you are ready to try this immediately; however, I want to revisit one treasure box from this updated method very briefly…let’s take another look at first pitch strikes.

These are from another Louisville Bats game at Louisville Slugger Field; this time the Columbus Clippers are in town and the remarkable Tony Cingrani is starting for the Bats.  If you aren’t familiar with Cingrani, he’s a really damn good pitcher.  I wanted to use this game as an example of how the scorekeeper can readily identify first pitch strikes for point of discussion or analysis, using the new updated notation technique.


In a matter of a few minutes, I can look at both completed scoresheets and build whatever narrative I deem necessary from not only the pitch counts, but the pitch order itself.  Beyond the final score and the lines and who hit a dinger and how many ribbies what part of the order produced, if you weigh first pitch strikes as more of a pitcher efficiency exercise and less of an eager-beaver approach by the batters, there’s a lot going on here.  Focusing on pitcher efficiency, let’s start by looking at Cingrani (5 innings) and the rest of the Bats bullpen staff (3 innings) and compare their efforts in regards to first pitch strikes!

This is how easy it is…any PA box that does not have a number “1” in it, that’s a first pitch strike! BAM! I don’t even have to think at this point!


I would have to think about it if the first pitch hits a batter, though…that isn’t a first pitch strike.

Tony Cingrani, first pitch strike percentage = .652
1st: 3-3 (3 total)
2nd: 4-6 (7 total, 7-9 overall)
3rd: 4-7 (11 total, 11-16 overall)
4th: 1-3 (12 total, 12-19 overall)
5th: 3-4 (15 total, 15-23 overall)

Mike MacDougal, first pitch strike percentage = .166
6th: 1-3 (1 total)
7th: 0-3 (1 total, 1-6 overall)

Chad Reineke, first pitch strike percentage = .444
7th: 2-2 (2 total)
8th: 1-3 (3 total, 3-5 overall)
9th: 1-4 (4 total, 4-9 overall)

MacDougal and Reineke are easy to compare, both having faced less than 10 batters but more than 5.  Cingrani’s results are awesome, even without a textbook for comparison.  I don’t have a baseline metric for what an optimal first strike percentage is, for relievers or for starters,  but with enough completed scoresheets in hand with this type of notation, and perhaps some data on WARP and FIP to do some on-the-fly correlation, think about the possibilities of expanding this data just for yucks!! I love it!

The Bats beat the Clippers 5-2, Cingrani got the W, and the Bats pitching staff recorded a whopping 16 strikeouts in this game (and also 6 walks).  Let’s look at Clippers starting pitcher T.J. House (who went the 8-inning distance) and compare his first strike percentage.

T.J. House, first strike percentage = .696
1st: 3-4 (3 total)
2nd: 3-4 (6 total, 6-8 overall)
3rd: 3-3 (9 total, 9-11 overall)
4th: 2-3 (11 total, 11-14 overall)
5th: 4-6 (15 total, 15-20 overall)
6th: 3-6 (18 total, 18-26 overall)
7th: 3-3 (21 total, 21-29 overall)
8th: 2-4 (23 total, 23-33 overall)

By a few percentage points, House’ first strike percentage was slightly better than Cingrani’s.  It’s also notable that House’s consistency in this respect was very good, even as he went on for more innings, yet fewer pitches than Cingrani (Tony’s pitch count was blown out a bit by the 5 walks he issued, yet House only struck out four batters).

No conclusion intended here, I’m only sharing my brain with you as I start to gleefully disseminate all of the joy and fun that a scorekeeper can experience with this method (particularly a scorekeeper who espouses the philosophy of intermediate baseball analysis at this level of detail).  Just imagine, for instance, applying a modifier to Bill James’ Game Score that awards a pitcher points for first pitch strikes, or for getting from behind in counts!

Developing these new practices and continuous efforts to improve my personal application of the craft of scorekeeping is one of the most exciting things about this activity.  I always try to break new ground every season, and I’m not too proud to say that cracking this particular nut is probably the most significant self-improvement I’ve made, and at the same time the easiest change I’ve ever had to make.  It is my honor and pleasure to share it with you!

If you have any questions or comments, leave a note below, or follow me on twitter (@yoshiki89) and let’s talk about scorekeeping!

Coming up next:

Part Three: Who’s pitching now?
The conclusion of counting pitches; what notation I use on how to keep track of who’s pitching, and how to tally their pitches on the scoresheet.

Monday, July 15, 2013

Who's Your LOOGY?

It's unfortunate that the run we all had at Big Leagues Magazine came to such an abrupt end, but life is full of changes.  I will always be proud of the work that myself and dozens of others did at BLM; here's a reprint of a piece I wrote in May that I'm considering updating at the end of the 2013 season.


Baseball today is a game that employs a great deal of specialization, more than it ever did as recently as twenty or thirty years ago and exponentially more than it did during its historical infancy.  The designated hitter, the pinch hitter, and the relief pitcher (particularly the closer) are some of the more profound and commonly accepted areas of specialization.  The landscape of baseball strategy is always changing, and newer, more nascent forms of specialization have emerged and will continue to emerge as performance aspects of the game change over time.  One of the most curious and readily discussed areas of specialization is certainly the left-handed specialist, affectionately known as the LOOGY.

LOOGY is a term that’s origin has been attributed to John Sickels, and is an acronym for Lefty One-Out GuY…it’s fun to say, while difficult for many to understand how well the use of a LOOGY works or doesn’t work.  The primary focus of the left-handed specialist is to exploit the advantage a left-handed pitcher has when facing a left-handed batter.  Wikipedia uses a photo of Jesse Orosco as an example of a “left-handed specialist,” in order to clear the air on the definition.  The world at large will recognize that an opposite advantage (real, perceived, or assumed) is a simple function of adopting the study of splits from a strategic standpoint; in this case LH/RH splits for batters as well as pitchers.  Some batters tend to hit better when facing opposite-handed pitchers, and vice-versa for pitchers and opposite-handed batters.  The same is true for equal-handed pitchers; the value of understanding specific head-to-head player/pitcher matchups plays on both of these principles.

During the latter third of the 2012 season, Doug Thorburn at Baseball Prospectus elaborated on the use of the LOOGY as a function of the platoon advantage, reporting that in that season, left-handed pitchers were used for 31 percent of all plate appearances and left-handed batters accounted for 44 percent of all plate appearances.  Here’s the table he provided with 2012 platoon splits for specific head-to-head matchups:
Thorburn’s piece provided a great deal of analysis on several LOOGYs and their pitching delivery, with some emphasis on usage patterns.

Take the LOOGY concept in respect to platoon advantage one step further, and it becomes more than obvious that while a particular player/pitcher matchup may generally make sense, it might make much more sense in a certain game situation under a certain condition.  Consider the following: Your reliever has allowed 2 men to reach base with 2 outs and a base hit will either allow the team at bat to take the lead or tie the game.  The batter approaching the box is a lefty, who tends to hit weakly against left-handed pitching.  What do you do?  Pull the reliever and call the LOOGY!  This totally makes sense, right?

Here’s the controversial part of this idea – you can’t predict baseball.  There are a few true outcomes, and generally the likelihood of the best outcome for the defensive manager is an out either for this batter, or for any baserunner, to end the inning.  Common sense isn’t always common practice, but it’s difficult to determine how effective this approach is most of the time.  Splits are splits, after all, and small sample size certainly plays a part.  For left-handed specialists with a considerable and consistent history of measurable performance towards the goal of getting an out in a situation such as this, the likelihood is that the specialist will get the out, as expected.  Baseball fans see this often, and this silo perception is the primary reason that the LOOGY is considered something more than a mythical realm of strategy today.

The topic of LOOGYs tends to drift more towards their principle as a function of asset management more than it does towards the validity of their usefulness on the field.  Many consider the LOOGY to be, among other things, a wasted roster spot for teams that hold them just for a subset of game situations that may or may not occur on a regular basis.  Roster spots (and, subsequently, payroll) are too precious to use on a pitcher who will only be brought in just once in a game to get one guy out.  Wouldn’t an asset who can retire the side efficiently, despite their handedness, fit into the mix better?  How many teams have roster spots exhausted by these occasional mound tourists?

There isn’t a great deal of manageable data regarding LOOGYs.  Very much like the Closer, this isn’t a hard player assignment designation, and isn’t really a specific database function despite the fact that the definition is simple enough to understand.  The role of the Closer has some tangible pitcher statistics tied to it, and more discrete game situations. However, there are other things to understand about LOOGYs that can shed some light on how teams use them, how much work they are getting, and how many roster spots might be used by LOOGYs.  To begin, we have to understand the evolution of the LOOGY.

The most recent, concise and fundamentally sound research I found on the LOOGY didn’t come from FanGraphs or even Baseball Prospectus, for that matter…it came from Scott Lindholm of Beyond the Scorecard, who used Baseball-Reference’s Play Index to compile data that validates that the LOOGY is “very real, and very recent.”
Scott’s research compiles the percentage of games in which a left-handed pitcher faced one batter in the chart above, which splendidly illustrates the rise to power of the LOOGY over a 62-season period of time.  Scott’s assertion: “The idea of a one-batter pitcher appears to have taken hold in the mid-80s and really took off around 1990 when Tony LaRussa began to use Rick Honeycutt in that role.”

Scott also provides a list of celebrated LOOGYs from this criteria that is worthy of a tattoo or, if you desire, a back-patch for your kutte:
Performance or value isn’t taken into account here, rather the number of games in which a pitcher only faced one batter (1Bg) and the percentage of games in which a pitcher faced only one batter.  This is certainly your LOOGY Hall of Heroes! Scott began with a list from 2000-current, and expanded it backward until he started running out of names; he notes that the names ran out much sooner than he expected.  His research helps shed some considerable light on the timeline of the LOOGY and identifies some names we can associate with this type of specialist, besides Jesse Orosco.

Let’s raise the periscope and look at Left-Handed Specialists during the 2012 season.  The purpose of this reconnaissance mission is to filter left-handed relievers in order to identify LOOGYs on any MLB staff, and review their usage, application, and general works of wonder.  However, some criteria have to be established first…it’s not that easy to pull LOOGYs out of anybody’s hat, at this point.

First things first, we want to look at left-handed relievers, none of them should have ever started a game, at all.  Then, we want to look at left-handed relievers who have appeared in an established minimum of games; at a glance, there was a significant data set for evaluation that allowed for reasonable sample size when the minimum was set at or around 40 games, so 40 games it is.  This may leave out a few choice left-handed specialists who came into the season early and left due to injury, or who got called up late and may have been used in this capacity towards the end of the season, but the objective is to establish a group that will allow us to identify a select echelon of persons and not to clean out the entire pool at once.  Baseball-Reference’s Play Index can be used to build the master list.

That’s the easy part; because the group is still significant once those filters are in place, there needs to be a way to identify how many relievers pitched the fewest amount of innings, as expressed by outs (after all the “OO” in LOOGY does mean “One-Out”).  Because Innings/Outs math is not our math, some numbers need to be adjusted.  If a LOOGY’s purpose is to come into a game and face one guy, and subsequently get one out, then we need to come up with a method of narrowing down the list of those relievers who faced the fewest batters per innings pitched.  IP registers the number of outs in tabulature most of us are used to seeing (1 IP = 3 outs, 0.2 IP = 2 outs, 0.1 IP = 1 out).  We’re looking for a small number that is as close to one as possible without flipping through hundreds of game logs, so this will work reasonably well as a starting point filter:
BFO is Batters Faced per Outs.  IPadj is Innings Pitched adjusted (for example, IP = 37.1, then IPadj = 37.333).  There are 3 outs in each 1 IP, so 37 innings = 111 outs, and 37.1 innings will be 37.333 x 3 = 111.999 outs.  Simple math can be exciting.  The result of 163 Batters Faced / 111.999 outs = 1.46 Batters Faced per Outs.  At a high level, this pitcher (Mike Zagurski), faced almost 1-1/2 batters for each out he recorded.  It’s not finite statistical derivation, but it’s a modest starting point to clean up the list before really diving deep into it.

These filters generate a list of 44 criteria-establish left-handed relievers in the 2012 MLB season that appeared in at least 40 games and faced the fewest batters per recorded outs.  Here’s all 44 of them, sorted by PWARP (a Baseball Prospectus statistic for Pitcher Wins Above Replacement Player):

There are a few more BP stats featured on this table for some light comparison: 
  • ·         RELP = Relief Percentage; positive relief decisions (saves and holds) divided by total relief decisions (saves, holds, blown saves), not critical to this study but good to know if relevance of the reliever’s performance is according to corny W/L type stats.
  • ·         RA = Run Average; not really a BP stat but as they are relievers and per the LOOGY model, typically come in when things need to happen a particular way, it’s interesting to note (runs allowed, earned of otherwise, divided by innings pitched, times 9).
  • ·         FAIR RA RELIEF = Fair Run Average in relief appearances; “Fair Runs” for starting pitchers differ from traditional assignment of runs in that a pitcher who leaves the game is charged with the expected run value of any bequeathed runners left on base, whether or not they eventually score…this is the same, but for Relievers.  Consider its inclusion here as a way of cross-checking RA.

A nifty group, indeed.  It should be noted that the only pitcher from the “Hall of LOOGY Heroes” that appears in this table is Randy Choate.  It’s probably no surprise to see Aroldis Chapman at the top of this list after his amazing 2012 season.  We already know that Chapman is a darn fine left-handed reliever, so are Jake McGee, Sean Marshall, and Sean Doolittle.  A left-handed specialist should be good at getting outs (preferably by striking out their victims) and should not be walking very many batters.  From this data set, here are the best by K%:

This list represents those who had the best (lowest) BB%: 

There are only 3 relievers who made both top ten lists; Jake McGee, Sean Doolittle, and Sean Marshall.  Aroldis Chapman wasn’t in the bottom ten of the BB% list, he placed 15th overall.  The only reliever with a PWARP of 1 or higher that didn’t rank on either of these top ten lists was James Russell (40th in K%, 13th in BB%).

Still evaluating these limited-usage left-handed relievers, it’s true that avoidance of traditional W/L type pitching stats is intentional (other than the brief mention of RELP previously).  Many folks like to use FIP (Fielding Independent Pitching) to look at a pitcher’s performance independent of influences beyond his control, and it is never more appropriate to use FIP instead of ERA than it is for relievers, whose ERAs can be catastrophically dumped into demotion class by one or two rough outings.  It’s well known that pitchers tend to perform better or worse than their peripherals suggest, and one way to evaluate this is by subtracting ERA from FIP.  A positive value (ERA less than FIP) suggests that a pitcher is outperforming his peripherals, and a negative value (FIP less than ERA) means their peripherals are better than their ERA might indicate.

Overachievers and underachievers are listed only if their differential is 1 run or more:

A positive value might only suggest that a pitcher isn’t necessarily going to blow off the chart in a bad way, but that some regression can be expected in the future.  On the other hand, a negative number for starters might indicate robust strikeout-to-walk ratios and low stranded runner rates; two elements notable for relievers as well.  For a less granular discussion about the differences between FIP and ERA and what it might indicate, this elderly post on Fangraphs is worth a read.

Up to this point, the focus of this research has been on left-handed specialists who faced the least amount of batters in a greater number of games.  Now, we need to dig into answering the key question: Who’s Your LOOGY?  Let’s return to the list of 44 and identify the top 25 by fewest Batters Faced per Outs.

The use of BFO helped pare down the candidates, but there’s a glaring issue: is Aroldis Chapman really a LOOGY?  Well, no.  He certainly could be, if used in that type of situation, but it’s well-known that he typically faces more than one batter, and in 2012 was primarily used as a Closer.  There’s an slight variance in BFO that clouds the analysis to some extent, but not catastrophically so.  If a reliever faces one batter and records one out, BFO = 1.  If a reliever faces one batter and records 2 outs due to a double-play, BFO = 0.5.  If a reliever faces 2 batters, the first walks and the first strikes out, BFO = 2.  Mix these up, and the variance suggests what was seen on Scott Lindholm’s Hall of LOOGY Heroes.  Randy Choate, for instance, pitched in 478 games, of those he faced only one batter in 176 games, of 36.8%.  Choate is being used as an example primarily because his 1B% is higher than anyone else on that list.

Analysis!  There is no such thing as a LOOGY who is used exclusively in that capacity.  Not at all, particularly not in a set of data that consists of these simple criteria within a substantial class of data points.  Now there should be enough evidence to debunk the notion that any team is wasting a roster spot on a LOOGY; the perception is clearly not the reality.  All left-handed relievers who spend a considerable amount of time as a LOOGY in a LOOGY situation spend more of their time facing batters in non-LOOGY situations.

This is when we need to roll up the sleeves and look at game logs and simulate Lindholm’s thought process in identifying what will be known as the tr00 LOOGY…realistically, any of the 44 left-handed relievers can be called on for LOOGY duty (and according to BFO, they have been on several occasions).  What needs to be determined is how many of these leftys are more likely to be called on for LOOGY duty, narrowed down to one batter faced, one out recorded, and in how many games will this happen?

Review of each pitcher’s game log for 2012 on Baseball-Reference is where the investigation begins.  More criteria must be determined first.  Obviously, games where each pitcher faced 1 batter and recorded 1 out (or 0.1 IP) are going to be the easiest to filter.  This will be extended to include 1 BF and 0.2 IP (or even 1 IP, if it shows up) to account for situations where the LOOGY was brought in to face one guy, and got at least one out.  It’s only fair to also include games where the pitcher faced one batter and didn’t get an out…stuff happens, and the LOOGY might allow his adversary to reach base somehow; this still indicates the purpose was to bring him in to face one batter only.  It’s not fair to include games where a LOOGY faced one batter and didn’t record an out which resulted in the end of the game; for instance, a walk-off base hit.  Why not?  The intention may have been to bring the reliever to face more than one batter, that’s why not.  With a game-winning event that prevents the incidence of subsequent batters (and the possibility or not of subsequent relievers) it will never be known what the intent was.  This keeps the selection set finite, so those instances won’t be used. (For the record, this only happened 4 or 5 times total amongst the 44 game logs I reviewed).

Game logs for each pitcher reveal exactly what we’re looking for, in terms of LOOGY Utilization Percentage (also known as LUP); derived from qualifying single-batter scenarios (Q1BF) versus Games in Relief (GR).  In order to be established as a candidate for tr00 LOOGY, the pitcher must have been utilized in this role in a minimum of 25% of their games in relief.  It is my honor and privilege to present your tr00 LOOGYs of 2012:
Given what has already been determined, it should be of no surprise to any that Randy Choate figures very high on the list; he has a career 36.8% LUP (validated by Lindholm’s studies).  Furthermore, many of these high LUP pitchers in 2012 may be likely to appear in the Hall of LOOGY Heroes someday.  There were 8 pitchers who had LUP between 20-25%, 15 with LUP between 10-20%, and 13 with less than 10% LUP from the list of 44…Sean Doolittle (2.3%), Aroldis Chapman (1.5%), and Glen Perkins (1.4%) were at the bottom of the list with LUP of less than 4%.  It really doesn’t matter, but in case you were wondering:  5 of these pitchers are NL and 3 are AL.

The qualifying scenario where a LOOGY is brought in to face a single batter, yet fails to record an out that doesn’t result in the premature end of a game can be used as a high-level evaluation of LOOGY effectiveness.  Again, the “OO” in LOOGY stands for “One-Out.”  We can use these instances (xQ1BF) against Q1BF to determined LOOGY effectiveness (Leff) presented as a percentage, where 100% indicates that every time the pitcher enters a qualified LOOGY usage situation, they execute as intended – with at least 1 out recorded:

Who’s your LOOGY?  Mine is Javier Lopez!  With a significant number of games in relief, and being used as a LOOGY just over half of the time he appears in relief, he is effective in that role nearly 85% of the time!!  You might recall that the 2012 BP Annual referred to his release point and whiff rate as making him “one of the least comfortable LOOGY at-bats in the game.”  Luetge, Thatcher, Cedeno, and Rapada are nearly as good, followed closely by Rzepcynski and Choate.  Tyler Robertson, as he was in 2012, shouldn’t be your LOOGY, as during that season he didn’t execute as intended half of the time he appeared in relief as a LOOGY.  Analysis!

We could revisit some of the other metrics that were posted for the large left-handed reliever list, but that data wouldn’t apply to the tr00 LOOGYs in their specified role usage; it would only apply to their season as a whole.  It would be an interesting future study to extract those qualifying game-specific numbers and compile a list to validate and compare to the LOOGY effective percentage we’re using now.

This covered the 2012 season as a whole, your tr00 LOOGYs revealed.  It’s now 2013, and we have a set of small sample size data we can dive into, using the same established criteria used to analyze 2012.  First, the minimum of games needs to be reset.  Where 40 games (roughly 25% of the regular season) was the previous minimum, reviewing the entire list of 2013 left-handed relievers with the lowest BFO confirms that we can use 25% again to capture the largest sample of efforts for the season so far.  Most MLB teams had played around 31-33 games as of May 8, 25% of that is 8 games.

Here are the top 25 left-handed relievers, by the lowest value of Batters Faced per Outs:

Now it’s time to poll the game logs for each pitcher and derive the LOOGY Utilization Percentage to reveal the tr00 LOOGYs for the season so far.  Subsequently, the LOOGY effectiveness percentage will be calculated from the game log data where a single batter was faced and no outs recorded. 

There are a total of 56 left-handed pitchers who have appeared in at least 8 games in relief.  17 of those pitchers have faced at least 2 batters in each game they appeared in.  16 pitchers have only faced a single batter once, 4 of them failed to record an out when doing so.

WARNING! Gory Small Sample Size Miasma to follow!!

It’s apparent that LOOGY usage overall is still a work-in-progress for most teams, but as before there is a considerable line of demarcation between relievers used as a LOOGY over 20% of the time (14) and relievers being used as a LOOGY less than 20% of the time (24).  The tr00 LOOGY list for 2012 included only those with LUP of 25% or greater; due to the small sample size miasma, that will be extended to 20% or greater.  Presenting your tr00 LOOGYs for the 2013 season (as of May 8), sorted by LUP:
Randy Choate retains his throne as one of the Kings of LOOGY, but Javier Lopez’ usage has apparently slipped since 2012.  He’s been making more 3-out appearances (3 times) and 2-out appearances (4 times, not counting 2-out appearances with a single batter faced), but he has also faced more than one batter 5 times and only recorded one out.  Is this regression?  Or just a change in management approach?  There are some new names on the list, some of them had light LUP in 2012 but are seeing more usage now.  Paco Rodriguez only appeared in a handful of games last year, and was the first 2012 draft pick to see MLB service in the same year he was drafted.  Rich Hill has the highest LUP for the fewest games, one-third of his appearances have been LOOGY usage situations.

Joe Thatcher’s LUP is similar to that of 2012.  Donnie Veal is the next-highest in LUP behind Choate.  Let’s plug in our LOOGY effectiveness percentages and compare the results.

Matt Thornton, Brian Matusz, and James Russell have yet to face a single batter only and fail to record an out, so their Leff% is stellar, at the moment.  Choate should have the crown in this list simply for the fact that his utilization is high, and so is his effectiveness.  As for Rich Hill, he’s probably not very good at this and Donnie Veal definitely isn’t.

So, who’s your LOOGY?  I’ve gotta go with Randy Choate; Javier Lopez may not see as many LOOGY usage this season as he did last year, and considering regression, you can almost count on Thornton, Matusz, and Russell to fumble a few times throughout the season.  Just because they haven’t so far, doesn’t mean they won’t.  Choate is also a safe pick, where his career effectiveness will continue to hover around a percentage that is less than the success he’s enjoying now, he’s going to continue to work in our definition of LOOGY situations, and will also be consistent in doing so. 

It’s a long season, and a lot of this is going to change; we might also see overall LOOGY utilization climb as the season progresses.  

Originally published in Big Leagues Magazine, May 15, 2013


Related Posts Plugin for WordPress, Blogger...