Showing posts with label randy choate. Show all posts

Monday, April 14, 2014

For Those Of You Scoring At Home: Counting Pitches - Part Three

This is a continuous series of posts where I share some intermediate-to-advanced scorekeeping methods and tips.  The assumption here is that you’ve already made it through “Scorekeeping 101” and are working out ways to improve your skills and expand your enthusiasm for scorekeeping.  I’m also assuming you are using the current version of my customized scoresheet, which you can download for FREE, as I will use it for all of these examples unless otherwise specified.  Get your pencil ready, the game is about to start!

In Part One of this series, I demonstrated my methodology (and notation) for tracking pitches during a game using the current version of my customized scoresheet (you can download it for FREE right here).  In Part Two, I expanded upon this system to reveal my own method for using the same (or similar) notation to track the order of those pitches quickly, easily, and effectively. Before we go any further, it’s important that you revisit what was detailed in both of those posts, as I’m going to build on that for this final topic in the epic “Counting Pitches” trilogy…how to keep track of who’s pitching and to whom, and how to use the notation to tally their respective pitches on the scoresheet.
Wouldn’t life be simpler if, as in the olden days of yesteryear, a pitcher just stayed in the entire game and finish the job he started? Sure it would, but those days are so gone, we can’t even fathom what they were like…even among the geezerest of us all.  As the pitches throughout the game are being tracked with the notation system, part of the purpose of all of this documentation is to have a record of something above and beyond who pitched when. I want to look at a finished scoresheet and deduce, without unnecessary brain-cramp, when they pitched, who they faced, and of course, how many pitches – particularly, how many total pitches and how many of those pitches were strikes.

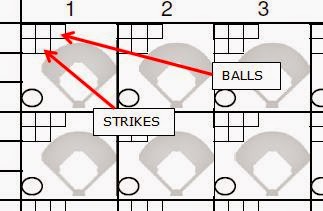
First of all, let’s revisit the area of the scoresheet in which I track the pitches (and the order of those pitches, if we are so inclined)…the “pitch boxes” found in each Plate Appearance Box; “balls” upstairs, “strikes” downstairs:


Also, if you will recall in Counting Pitches Part One, at the end of that post I briefly touched upon the methodology of counting the pitches, and provided an example of how this happened and where it goes on the scoresheet:
It was here that I first touched on the method of counting the marks in the “pitch box” area, plus what happens (the result of the PA) in the Plate Appearance box. For a 4-pitch walk, I’ll count the 3 notations in the “ball boxes” plus the final notation of “BB” as the fourth pitch; for an 0-2 home run, the 2 notations in the “strike boxes” plus the final notation of HR totals 3 pitches.

The main point in this example, is that the total pitches for each inning are perpetually additive, so where the pitch count in the first inning was 18-13 (18 pitches, 13 strikes) there were 14 pitches, 9 strikes in the 2nd inning making the total recorded as 32-22 (which is 18 pitches + 14 pitches = 32 total pitches, and 13 strikes + 9 strikes = 22 total strikes). I also pointed out that regarding the balls in play that aren’t in or near the boxes that I’ve been counting as strikes, including the called strike 3 (or swinging strike 3, or ‘foul-tip-to-mitt-caught-for-strike-three,’ there is another type of pitch not recorded in or near those boxes that isn’t in play and still needs to be counted.  That type, of course, is a ball…and it usually happens on the 4th ball of a walk (BB) or the ball that hits a batter (HP), even if one thinks that ball was a strike.

I’m not trying to beat this to death, but to me, counting inning-by-inning pitch counts in this manner is really important.  After a few innings of only recording totals for each inning only, you’ll need a calculator to understand what’s going on.  Doing it this way, you know how many total pitches have been thrown in 3 innings ‘just like that,’ and you can still tell the difference between one inning and another ‘on the fly’ (without a calculator), letting the fella sitting next to you at the game know “Verlander threw 38 pitches in that inning, only 14 in the previous inning” – even if that fella doesn’t give a darn about that.  For better reasons than that, when that pitcher is finished, his totals (pitches, strikes) are pretty much totaled up, without a calculator (which can spoil a good time at the game, you know).

Here’s the area on the scoresheet where the pitch counts are documented, there’s a big red arrow pointing right to it.  In the first inning (and more often than not, for a few innings afterward) the starting pitcher is on the mound.  Sure, that’s a very broad assumption, and one that dips into the realm of the “blinding flash of the obvious,” but stay with me on this:
I’ve also circled the spot where the pitcher’s jersey number is recorded.  Again, that’s not super important now, in regards to the starting pitcher, but it will be for those who relieve him.

Let’s go ahead and set up a game so I can start recording some of this.  It’s September 2, 2013; the last game of the season for the Louisville Bats as they wrap up a 2-game series against the visiting Indianapolis Indians – LHP Andy Oliver is starting for the Indians.

First Inning: Oliver retires the first 3 batters in order on a flyout to LF and 2 swinging strikeouts.  He does so with 17 pitches, 11 of them were strikes.

Second Inning: Mike Hessman doubles to start the inning, Oliver notches two more swinging strikeouts (one of them on a dropped 3rd strike), he hits Nevin Ashley and gets Jason Donald to groundout to 3B. 19 pitches, 13 strikes in the inning, so the running total recorded in the pitch area box for the inning is 37 pitches, 24 strikes.

Everybody counts and adds differently, so here’s a tip from me: Instead of counting the pitches for the second inning separately, and then adding to the previous inning totals, I start counting the second inning from the last number counted in the first.  In the above example, I start counting with Oliver’s first pitch to Hessman as “18,” then go through all the pitches to come up with 37 as the total – then I start counting with Oliver’s first strike to Hessman as “12,” then go through all the strikes to come up with 24 total. You can do whatever you want, but there’s only so much time between innings, and personally I don’t like to get behind on this during the game. So, here’s the “running count” for the second inning detail above:

For the third inning, then, Oliver  faces 4 batters, allowing a single and striking out three (all swinging, impressive!) for a total of 52 pitches, 36 strikes so far (over 3 innings of work).

In the fourth inning, Oliver walks Hessman on 5 pitches, then retires the next two batters he faces on popouts, both to the second baseman.  Suddenly, things get weird – the skies open up, torrential rains occur, and the game is held up on a rain delay.  The call is made as Oliver has a 1-0 count on Ashley; I’m a good scorekeeper so I record the time the rain delay started to the left of the PA box.

As the delay approaches the hour mark, one can be sure that once play resumes, there will certainly be a new pitcher. After an hour and 30 minutes, Ryan Reid starts warming up, and it’s official…a rain delay-forced pitching change!

This is an unorthodox manner in which to change pitchers during an inning, especially since it’s occurring in the middle of an at bat, but these things do happen, so this is a great opportunity to demonstrate the notation and methodology.

First things first, I need to “close” Oliver’s account on the scoresheet.  I can’t finalize all of his line score stats, as he is responsible for the runner on first, but I can record what I know now, as well as tally up his final pitch count and add the appropriate graphic notation on the scoresheet so it is apparent when he finished pitching and when the new pitcher took over. Oliver’s final pitch count goes where I’ve been recording it, I’m going to leave some room to the right and add a backwards slash that creeps into the area right above it.

To the left of the PA box, I make a note that Oliver’s count ended with 1-0 (I’m doing this right above my rain delay notation). Since the change is occurring during an AB, at the top of the PA box I record Oliver’s jersey number (41), then a slash with the new pitcher’s jersey number (43).  I also record Oliver’s jersey number only (not Reid’s…at least not yet) in the upper left hand corner of the box above the “pitch count area” that hasn’t been used for anything up to this point.
You can get creative with your own notation, but the rule to follow is simple: whatever you come up with, you need to be able to remember how you did it again and again. For any of my scoresheets where a pitcher changes during an AB, for whatever reason, I follow the same protocol consistently…thus avoiding the “uh, what the hell was this all about” many years later when I’m recalling this game via the document. Some situations arise only once in a blue moon; simplicity and consistency are important.

The game resumes at 4:01pm, I add this to my rain delay notes to the left of Ashley’s AB box and record the total time of the delay. Reid strikes out Ashley on 3 pitches (all of them strikes) to end the inning.  Oliver’s line score can now be closed out, and so can the other totals for the inning (Runs, Hits, Errors, LOB). I record Reid’s total pitch count on the line right above the pitch area box, adjacent to the backslash I left hanging up a little bit, and I also record his jersey number in the upper right hand corner, on the opposite side of Oliver’s number.
Now all this funkiness is as clear as glass on the scoresheet. With traditional scorekeeping methods, tracking this single event would require copious handwritten notes that would threaten to destroy the flow of the scoresheet. With my method, everything is documented cleanly and accurately.  Here’s what we know, just by looking at the detail featured above:
·        41 Andy Oliver faced 15 batters, threw 69 pitches (43 strikes)
·        At the 1-0 count for the 16th batter he faced, rain delay called at 2:17pm
·        Game resumed at 4:01, at which time 43 Ryan Reid replaced him
·        43 Ryan Reid finished the inning facing 1 batter, threw 3 pitches (3 strikes)

So in that large, previously unused area, it can now be revealed that this is an important method of recording who is pitching and when they are pitching.  Remember, to start the game I didn’t record Oliver’s jersey number up there…he’s the starting pitcher, the “Pitchers Faced” log below indicates this so it isn’t necessary (however, feel free to record his number if you want, in that area at the start of the game…it’s redundant, but that doesn’t really matter).  In the 4th Inning, in that same area, his number in the upper left corner indicates that he was the pitcher that started that inning. Reid’s number in the upper right corner indicates that he was the pitcher that ended the inning.

Now that I’ve introduced this method of notation, I can carry this through the rest of the game and identify who pitched when, what their pitch count was, and easily identify pertinent info to tally each pitcher’s line score. I detailed one “dotted line” to illustrate this, I’m sure you can visualize the rest…Reid stayed in for the 5th inning, then was relieved by Graham Godfrey, and so on so forth.
I know you’re rubbing your eyes right now, yes that is Matt Hague brought in during the 9th inning (in a SAVE situation, no less), who allowed a walk-off Grand Slam to Denis Phipps to end the game. Baseball is crazy, especially Minor League Baseball on the last day of the season, after September callups.

Here are the completed scoresheets for this game.

Now, let’s look at a more traditional pitching change during an inning…it works very much the same way, but with one distinct difference. For this example, let’s go back to Busch Stadium in St Louis, MO, for the 2013 World Series Game 3.  Yes, that’s the game that ended with an obstruction call.  It’s the bottom of the 7th inning; Jake Peavy started the game, went 4 innings – he threw 63 pitches (43 strikes) and was relieved in the 5th inning by Felix Doubront, who worked 2 innings, throwing 25 pitches (15 strikes).  The game is tied 2-2, and Craig Breslow is on the mound now, his jersey number is 32 and he’s facing the top of the order.

Breslow faces 2 batters; Matt Carpenter who reaches on a single to SS, and Carlos Beltran who is hit by the first pitch he sees.  Two men on, nobody out; John Farrell decides he has had enough of Breslow’s heroics and brings in Junichi Tazawa to face the righty Matt Holliday.  Before Tazawa is ready to strike, I need to finalize whatever information I can on the scoresheet…which happens to be Breslow’s pitch totals and all of his line score except for the R/ER.
I record his pitch totals in the pitch area, add the backwards slash, but I don’t record Tazawa’s number in the upper right corner yet.  Why? Because he, too, may be relieved by another pitcher…I don’t know yet for sure.  I do know that I need to indicate somehow that Beltran was the last batter Breslow faced, and that Holliday will be the first batter that Tazawa will face.

I’m going to do this in between Beltran’s and Holliday’s AB boxes.  I’m going to do it with a backward slash that “joins” both boxes – in Beltran’s AB box zone, I record Breslow’s jersey number, and in Holliday’s AB box zone, I record Tazawa’s.
Now it’s very clear…Breslow faced Carpenter and Beltran, and Tazawa is taking over. KaBOOM!!

Let’s continue…Holliday doubles, driving in Carpenter and Beltran (Holliday to 3B on the throw).  Well, THAT worked out, didn’t it? Tazawa strikes out Matt Adams and Yadier Molina, walks David Freese (who is replaced by a pinch runner, Daniel Descalso), and the inning ends when John Jay flies out to CF. Now I’m going to update the pitch area with this information. This is what the AB boxes look like.
At a glance, it’s apparent that Breslow is responsible for the two runs that did score…again, having the jersey numbers between the AB boxes provides a quick graphic reference of the pitching change, what happened before it, and what happened after it. I included a second graphic of the same AB boxes (with red border) to illustrate the work of both pitchers.

I update the pitch detail area with Tazawa’s jersey number in the upper right corner, add his total pitch count.  In the Runs/Hits/Errors/LOB fields, the total for the inning is updated, as is Breslow’s line score (but not Tazawa’s yet…he might stay in the the next inning…at a minimum, I’ve recorded what he did this inning in the AB boxes and pitch detail area, but I’m going to leave his line score alone until I know how the bottom of the 8th is going to start).
For a moment, don’t look at the AB boxes…just focus on the pitch area detail.  Breslow (32) is on the left (started), Tazawa (36) is on the right. Piece of cake.  Two pitchers in the inning, 2 runs, 2 hits, 0 errors, 0 left on base.

Who allowed the hits? Who is charged with the runs? Now you can look at the AB boxes again. Fantastic!!

If Tazawa stays in for the 8th inning, I don’t have to “carry over” his jersey number or anything…just his running pitch count total. As it turns out, Brandon Workman takes the mound for the bottom of the 8th, so his number goes in the upper left corner, I finalize his line score, and start anew with his pitch count totals.

It gets a little messier for 3 pitchers in an inning, but still very manageable.  From the same game, but the top of previous inning:
Starter Joe Kelly (58) faced two batters, was replaced by the LOOGY Randy Choate (36) for one batter and didn’t record an out, then was replaced by Seth Maness (61). Once again, I included a second graphic (with red border) of the same AB boxes to illustrate the work of all three pitchers, as indicated by the notation between the AB boxes.

As it was with one pitching change, the pitch detail area looks similar when there are two pitching changes…room is at a premium, but heck…now that you know what you’re looking at, it unfolds like a neat little story.
This graphic notation method really helps out when working out the line score! One no longer has to rely on their memory…let the scoresheet do the work!!

I’d show you what 4 pitchers in an inning looks like, but I don’t want your head to explode.

Here are the completed scoresheets for this game:


This concludes the “Counting Pitches” trilogy for this series, good luck!!

Coming up Next: 
Tracking Team RISP - It's Trickier Than You Might Think

If there are any topics you’d like to see covered in future installments, please let me know here (via comment) or connect with me on Twitter or Facebook!

Here’s hoping I’ll see you at the ball game, and if I do…be sure you have plenty of sunscreen on!!

Monday, July 15, 2013

Who's Your LOOGY?

It's unfortunate that the run we all had at Big Leagues Magazine came to such an abrupt end, but life is full of changes.  I will always be proud of the work that myself and dozens of others did at BLM; here's a reprint of a piece I wrote in May that I'm considering updating at the end of the 2013 season.


Baseball today is a game that employs a great deal of specialization, more than it ever did as recently as twenty or thirty years ago and exponentially more than it did during its historical infancy.  The designated hitter, the pinch hitter, and the relief pitcher (particularly the closer) are some of the more profound and commonly accepted areas of specialization.  The landscape of baseball strategy is always changing, and newer, more nascent forms of specialization have emerged and will continue to emerge as performance aspects of the game change over time.  One of the most curious and readily discussed areas of specialization is certainly the left-handed specialist, affectionately known as the LOOGY.

LOOGY is a term that’s origin has been attributed to John Sickels, and is an acronym for Lefty One-Out GuY…it’s fun to say, while difficult for many to understand how well the use of a LOOGY works or doesn’t work.  The primary focus of the left-handed specialist is to exploit the advantage a left-handed pitcher has when facing a left-handed batter.  Wikipedia uses a photo of Jesse Orosco as an example of a “left-handed specialist,” in order to clear the air on the definition.  The world at large will recognize that an opposite advantage (real, perceived, or assumed) is a simple function of adopting the study of splits from a strategic standpoint; in this case LH/RH splits for batters as well as pitchers.  Some batters tend to hit better when facing opposite-handed pitchers, and vice-versa for pitchers and opposite-handed batters.  The same is true for equal-handed pitchers; the value of understanding specific head-to-head player/pitcher matchups plays on both of these principles.

During the latter third of the 2012 season, Doug Thorburn at Baseball Prospectus elaborated on the use of the LOOGY as a function of the platoon advantage, reporting that in that season, left-handed pitchers were used for 31 percent of all plate appearances and left-handed batters accounted for 44 percent of all plate appearances.  Here’s the table he provided with 2012 platoon splits for specific head-to-head matchups:
Thorburn’s piece provided a great deal of analysis on several LOOGYs and their pitching delivery, with some emphasis on usage patterns.

Take the LOOGY concept in respect to platoon advantage one step further, and it becomes more than obvious that while a particular player/pitcher matchup may generally make sense, it might make much more sense in a certain game situation under a certain condition.  Consider the following: Your reliever has allowed 2 men to reach base with 2 outs and a base hit will either allow the team at bat to take the lead or tie the game.  The batter approaching the box is a lefty, who tends to hit weakly against left-handed pitching.  What do you do?  Pull the reliever and call the LOOGY!  This totally makes sense, right?

Here’s the controversial part of this idea – you can’t predict baseball.  There are a few true outcomes, and generally the likelihood of the best outcome for the defensive manager is an out either for this batter, or for any baserunner, to end the inning.  Common sense isn’t always common practice, but it’s difficult to determine how effective this approach is most of the time.  Splits are splits, after all, and small sample size certainly plays a part.  For left-handed specialists with a considerable and consistent history of measurable performance towards the goal of getting an out in a situation such as this, the likelihood is that the specialist will get the out, as expected.  Baseball fans see this often, and this silo perception is the primary reason that the LOOGY is considered something more than a mythical realm of strategy today.

The topic of LOOGYs tends to drift more towards their principle as a function of asset management more than it does towards the validity of their usefulness on the field.  Many consider the LOOGY to be, among other things, a wasted roster spot for teams that hold them just for a subset of game situations that may or may not occur on a regular basis.  Roster spots (and, subsequently, payroll) are too precious to use on a pitcher who will only be brought in just once in a game to get one guy out.  Wouldn’t an asset who can retire the side efficiently, despite their handedness, fit into the mix better?  How many teams have roster spots exhausted by these occasional mound tourists?

There isn’t a great deal of manageable data regarding LOOGYs.  Very much like the Closer, this isn’t a hard player assignment designation, and isn’t really a specific database function despite the fact that the definition is simple enough to understand.  The role of the Closer has some tangible pitcher statistics tied to it, and more discrete game situations. However, there are other things to understand about LOOGYs that can shed some light on how teams use them, how much work they are getting, and how many roster spots might be used by LOOGYs.  To begin, we have to understand the evolution of the LOOGY.

The most recent, concise and fundamentally sound research I found on the LOOGY didn’t come from FanGraphs or even Baseball Prospectus, for that matter…it came from Scott Lindholm of Beyond the Scorecard, who used Baseball-Reference’s Play Index to compile data that validates that the LOOGY is “very real, and very recent.”
Scott’s research compiles the percentage of games in which a left-handed pitcher faced one batter in the chart above, which splendidly illustrates the rise to power of the LOOGY over a 62-season period of time.  Scott’s assertion: “The idea of a one-batter pitcher appears to have taken hold in the mid-80s and really took off around 1990 when Tony LaRussa began to use Rick Honeycutt in that role.”

Scott also provides a list of celebrated LOOGYs from this criteria that is worthy of a tattoo or, if you desire, a back-patch for your kutte:
Performance or value isn’t taken into account here, rather the number of games in which a pitcher only faced one batter (1Bg) and the percentage of games in which a pitcher faced only one batter.  This is certainly your LOOGY Hall of Heroes! Scott began with a list from 2000-current, and expanded it backward until he started running out of names; he notes that the names ran out much sooner than he expected.  His research helps shed some considerable light on the timeline of the LOOGY and identifies some names we can associate with this type of specialist, besides Jesse Orosco.

Let’s raise the periscope and look at Left-Handed Specialists during the 2012 season.  The purpose of this reconnaissance mission is to filter left-handed relievers in order to identify LOOGYs on any MLB staff, and review their usage, application, and general works of wonder.  However, some criteria have to be established first…it’s not that easy to pull LOOGYs out of anybody’s hat, at this point.

First things first, we want to look at left-handed relievers, none of them should have ever started a game, at all.  Then, we want to look at left-handed relievers who have appeared in an established minimum of games; at a glance, there was a significant data set for evaluation that allowed for reasonable sample size when the minimum was set at or around 40 games, so 40 games it is.  This may leave out a few choice left-handed specialists who came into the season early and left due to injury, or who got called up late and may have been used in this capacity towards the end of the season, but the objective is to establish a group that will allow us to identify a select echelon of persons and not to clean out the entire pool at once.  Baseball-Reference’s Play Index can be used to build the master list.

That’s the easy part; because the group is still significant once those filters are in place, there needs to be a way to identify how many relievers pitched the fewest amount of innings, as expressed by outs (after all the “OO” in LOOGY does mean “One-Out”).  Because Innings/Outs math is not our math, some numbers need to be adjusted.  If a LOOGY’s purpose is to come into a game and face one guy, and subsequently get one out, then we need to come up with a method of narrowing down the list of those relievers who faced the fewest batters per innings pitched.  IP registers the number of outs in tabulature most of us are used to seeing (1 IP = 3 outs, 0.2 IP = 2 outs, 0.1 IP = 1 out).  We’re looking for a small number that is as close to one as possible without flipping through hundreds of game logs, so this will work reasonably well as a starting point filter:
BFO is Batters Faced per Outs.  IPadj is Innings Pitched adjusted (for example, IP = 37.1, then IPadj = 37.333).  There are 3 outs in each 1 IP, so 37 innings = 111 outs, and 37.1 innings will be 37.333 x 3 = 111.999 outs.  Simple math can be exciting.  The result of 163 Batters Faced / 111.999 outs = 1.46 Batters Faced per Outs.  At a high level, this pitcher (Mike Zagurski), faced almost 1-1/2 batters for each out he recorded.  It’s not finite statistical derivation, but it’s a modest starting point to clean up the list before really diving deep into it.

These filters generate a list of 44 criteria-establish left-handed relievers in the 2012 MLB season that appeared in at least 40 games and faced the fewest batters per recorded outs.  Here’s all 44 of them, sorted by PWARP (a Baseball Prospectus statistic for Pitcher Wins Above Replacement Player):

There are a few more BP stats featured on this table for some light comparison: 
  • ·         RELP = Relief Percentage; positive relief decisions (saves and holds) divided by total relief decisions (saves, holds, blown saves), not critical to this study but good to know if relevance of the reliever’s performance is according to corny W/L type stats.
  • ·         RA = Run Average; not really a BP stat but as they are relievers and per the LOOGY model, typically come in when things need to happen a particular way, it’s interesting to note (runs allowed, earned of otherwise, divided by innings pitched, times 9).
  • ·         FAIR RA RELIEF = Fair Run Average in relief appearances; “Fair Runs” for starting pitchers differ from traditional assignment of runs in that a pitcher who leaves the game is charged with the expected run value of any bequeathed runners left on base, whether or not they eventually score…this is the same, but for Relievers.  Consider its inclusion here as a way of cross-checking RA.

A nifty group, indeed.  It should be noted that the only pitcher from the “Hall of LOOGY Heroes” that appears in this table is Randy Choate.  It’s probably no surprise to see Aroldis Chapman at the top of this list after his amazing 2012 season.  We already know that Chapman is a darn fine left-handed reliever, so are Jake McGee, Sean Marshall, and Sean Doolittle.  A left-handed specialist should be good at getting outs (preferably by striking out their victims) and should not be walking very many batters.  From this data set, here are the best by K%:

This list represents those who had the best (lowest) BB%: 

There are only 3 relievers who made both top ten lists; Jake McGee, Sean Doolittle, and Sean Marshall.  Aroldis Chapman wasn’t in the bottom ten of the BB% list, he placed 15th overall.  The only reliever with a PWARP of 1 or higher that didn’t rank on either of these top ten lists was James Russell (40th in K%, 13th in BB%).

Still evaluating these limited-usage left-handed relievers, it’s true that avoidance of traditional W/L type pitching stats is intentional (other than the brief mention of RELP previously).  Many folks like to use FIP (Fielding Independent Pitching) to look at a pitcher’s performance independent of influences beyond his control, and it is never more appropriate to use FIP instead of ERA than it is for relievers, whose ERAs can be catastrophically dumped into demotion class by one or two rough outings.  It’s well known that pitchers tend to perform better or worse than their peripherals suggest, and one way to evaluate this is by subtracting ERA from FIP.  A positive value (ERA less than FIP) suggests that a pitcher is outperforming his peripherals, and a negative value (FIP less than ERA) means their peripherals are better than their ERA might indicate.

Overachievers and underachievers are listed only if their differential is 1 run or more:

A positive value might only suggest that a pitcher isn’t necessarily going to blow off the chart in a bad way, but that some regression can be expected in the future.  On the other hand, a negative number for starters might indicate robust strikeout-to-walk ratios and low stranded runner rates; two elements notable for relievers as well.  For a less granular discussion about the differences between FIP and ERA and what it might indicate, this elderly post on Fangraphs is worth a read.

Up to this point, the focus of this research has been on left-handed specialists who faced the least amount of batters in a greater number of games.  Now, we need to dig into answering the key question: Who’s Your LOOGY?  Let’s return to the list of 44 and identify the top 25 by fewest Batters Faced per Outs.

The use of BFO helped pare down the candidates, but there’s a glaring issue: is Aroldis Chapman really a LOOGY?  Well, no.  He certainly could be, if used in that type of situation, but it’s well-known that he typically faces more than one batter, and in 2012 was primarily used as a Closer.  There’s an slight variance in BFO that clouds the analysis to some extent, but not catastrophically so.  If a reliever faces one batter and records one out, BFO = 1.  If a reliever faces one batter and records 2 outs due to a double-play, BFO = 0.5.  If a reliever faces 2 batters, the first walks and the first strikes out, BFO = 2.  Mix these up, and the variance suggests what was seen on Scott Lindholm’s Hall of LOOGY Heroes.  Randy Choate, for instance, pitched in 478 games, of those he faced only one batter in 176 games, of 36.8%.  Choate is being used as an example primarily because his 1B% is higher than anyone else on that list.

Analysis!  There is no such thing as a LOOGY who is used exclusively in that capacity.  Not at all, particularly not in a set of data that consists of these simple criteria within a substantial class of data points.  Now there should be enough evidence to debunk the notion that any team is wasting a roster spot on a LOOGY; the perception is clearly not the reality.  All left-handed relievers who spend a considerable amount of time as a LOOGY in a LOOGY situation spend more of their time facing batters in non-LOOGY situations.

This is when we need to roll up the sleeves and look at game logs and simulate Lindholm’s thought process in identifying what will be known as the tr00 LOOGY…realistically, any of the 44 left-handed relievers can be called on for LOOGY duty (and according to BFO, they have been on several occasions).  What needs to be determined is how many of these leftys are more likely to be called on for LOOGY duty, narrowed down to one batter faced, one out recorded, and in how many games will this happen?

Review of each pitcher’s game log for 2012 on Baseball-Reference is where the investigation begins.  More criteria must be determined first.  Obviously, games where each pitcher faced 1 batter and recorded 1 out (or 0.1 IP) are going to be the easiest to filter.  This will be extended to include 1 BF and 0.2 IP (or even 1 IP, if it shows up) to account for situations where the LOOGY was brought in to face one guy, and got at least one out.  It’s only fair to also include games where the pitcher faced one batter and didn’t get an out…stuff happens, and the LOOGY might allow his adversary to reach base somehow; this still indicates the purpose was to bring him in to face one batter only.  It’s not fair to include games where a LOOGY faced one batter and didn’t record an out which resulted in the end of the game; for instance, a walk-off base hit.  Why not?  The intention may have been to bring the reliever to face more than one batter, that’s why not.  With a game-winning event that prevents the incidence of subsequent batters (and the possibility or not of subsequent relievers) it will never be known what the intent was.  This keeps the selection set finite, so those instances won’t be used. (For the record, this only happened 4 or 5 times total amongst the 44 game logs I reviewed).

Game logs for each pitcher reveal exactly what we’re looking for, in terms of LOOGY Utilization Percentage (also known as LUP); derived from qualifying single-batter scenarios (Q1BF) versus Games in Relief (GR).  In order to be established as a candidate for tr00 LOOGY, the pitcher must have been utilized in this role in a minimum of 25% of their games in relief.  It is my honor and privilege to present your tr00 LOOGYs of 2012:
Given what has already been determined, it should be of no surprise to any that Randy Choate figures very high on the list; he has a career 36.8% LUP (validated by Lindholm’s studies).  Furthermore, many of these high LUP pitchers in 2012 may be likely to appear in the Hall of LOOGY Heroes someday.  There were 8 pitchers who had LUP between 20-25%, 15 with LUP between 10-20%, and 13 with less than 10% LUP from the list of 44…Sean Doolittle (2.3%), Aroldis Chapman (1.5%), and Glen Perkins (1.4%) were at the bottom of the list with LUP of less than 4%.  It really doesn’t matter, but in case you were wondering:  5 of these pitchers are NL and 3 are AL.

The qualifying scenario where a LOOGY is brought in to face a single batter, yet fails to record an out that doesn’t result in the premature end of a game can be used as a high-level evaluation of LOOGY effectiveness.  Again, the “OO” in LOOGY stands for “One-Out.”  We can use these instances (xQ1BF) against Q1BF to determined LOOGY effectiveness (Leff) presented as a percentage, where 100% indicates that every time the pitcher enters a qualified LOOGY usage situation, they execute as intended – with at least 1 out recorded:

Who’s your LOOGY?  Mine is Javier Lopez!  With a significant number of games in relief, and being used as a LOOGY just over half of the time he appears in relief, he is effective in that role nearly 85% of the time!!  You might recall that the 2012 BP Annual referred to his release point and whiff rate as making him “one of the least comfortable LOOGY at-bats in the game.”  Luetge, Thatcher, Cedeno, and Rapada are nearly as good, followed closely by Rzepcynski and Choate.  Tyler Robertson, as he was in 2012, shouldn’t be your LOOGY, as during that season he didn’t execute as intended half of the time he appeared in relief as a LOOGY.  Analysis!

We could revisit some of the other metrics that were posted for the large left-handed reliever list, but that data wouldn’t apply to the tr00 LOOGYs in their specified role usage; it would only apply to their season as a whole.  It would be an interesting future study to extract those qualifying game-specific numbers and compile a list to validate and compare to the LOOGY effective percentage we’re using now.

This covered the 2012 season as a whole, your tr00 LOOGYs revealed.  It’s now 2013, and we have a set of small sample size data we can dive into, using the same established criteria used to analyze 2012.  First, the minimum of games needs to be reset.  Where 40 games (roughly 25% of the regular season) was the previous minimum, reviewing the entire list of 2013 left-handed relievers with the lowest BFO confirms that we can use 25% again to capture the largest sample of efforts for the season so far.  Most MLB teams had played around 31-33 games as of May 8, 25% of that is 8 games.

Here are the top 25 left-handed relievers, by the lowest value of Batters Faced per Outs:

Now it’s time to poll the game logs for each pitcher and derive the LOOGY Utilization Percentage to reveal the tr00 LOOGYs for the season so far.  Subsequently, the LOOGY effectiveness percentage will be calculated from the game log data where a single batter was faced and no outs recorded. 

There are a total of 56 left-handed pitchers who have appeared in at least 8 games in relief.  17 of those pitchers have faced at least 2 batters in each game they appeared in.  16 pitchers have only faced a single batter once, 4 of them failed to record an out when doing so.

WARNING! Gory Small Sample Size Miasma to follow!!

It’s apparent that LOOGY usage overall is still a work-in-progress for most teams, but as before there is a considerable line of demarcation between relievers used as a LOOGY over 20% of the time (14) and relievers being used as a LOOGY less than 20% of the time (24).  The tr00 LOOGY list for 2012 included only those with LUP of 25% or greater; due to the small sample size miasma, that will be extended to 20% or greater.  Presenting your tr00 LOOGYs for the 2013 season (as of May 8), sorted by LUP:
Randy Choate retains his throne as one of the Kings of LOOGY, but Javier Lopez’ usage has apparently slipped since 2012.  He’s been making more 3-out appearances (3 times) and 2-out appearances (4 times, not counting 2-out appearances with a single batter faced), but he has also faced more than one batter 5 times and only recorded one out.  Is this regression?  Or just a change in management approach?  There are some new names on the list, some of them had light LUP in 2012 but are seeing more usage now.  Paco Rodriguez only appeared in a handful of games last year, and was the first 2012 draft pick to see MLB service in the same year he was drafted.  Rich Hill has the highest LUP for the fewest games, one-third of his appearances have been LOOGY usage situations.

Joe Thatcher’s LUP is similar to that of 2012.  Donnie Veal is the next-highest in LUP behind Choate.  Let’s plug in our LOOGY effectiveness percentages and compare the results.

Matt Thornton, Brian Matusz, and James Russell have yet to face a single batter only and fail to record an out, so their Leff% is stellar, at the moment.  Choate should have the crown in this list simply for the fact that his utilization is high, and so is his effectiveness.  As for Rich Hill, he’s probably not very good at this and Donnie Veal definitely isn’t.

So, who’s your LOOGY?  I’ve gotta go with Randy Choate; Javier Lopez may not see as many LOOGY usage this season as he did last year, and considering regression, you can almost count on Thornton, Matusz, and Russell to fumble a few times throughout the season.  Just because they haven’t so far, doesn’t mean they won’t.  Choate is also a safe pick, where his career effectiveness will continue to hover around a percentage that is less than the success he’s enjoying now, he’s going to continue to work in our definition of LOOGY situations, and will also be consistent in doing so. 

It’s a long season, and a lot of this is going to change; we might also see overall LOOGY utilization climb as the season progresses.  

Originally published in Big Leagues Magazine, May 15, 2013


Related Posts Plugin for WordPress, Blogger...